Hello,
thank you for this great application.
After a few weeks runtime, I noticed constant read activity from aw-server (60+ GB accumulated). Bytes written is roughtly 1/100 of that.
From quick observation, all read activity seems related to sqlite.
Read activity is going to be way more than the written data. Every query reads the database, aggregates/filters data. There might be optimizations to be made to reduce the reads can’t say for sure.
I created an account to come here to post about the write activity.
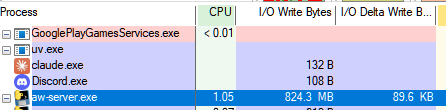
I’ve used Process Explorer (apart of sysinternals) to monitor aw-watcher and related exe.
Over 9 hours of intermittent use of my home PC - a couple of remote desktop sessions for about an hour, and then dinner, family time etc, so not really using it.
And aw-server.exe logged 824mb. Which is ~91mb/hr.
I asked Claude and ChatGPT what a monitoring program that tracks active windows, and they said:
819 MB over 9 hours = ~91 MB/hour
That’s definitely on the moderate-to-high side for a time-tracking application. Let me break this down:
Context:
Your rate: ~91 MB/hour
Daily projection: ~2.2 GB/day
Monthly: ~66 GB/month
Yearly: ~800 GB/year to your SSD
Is This Reasonable?
For ActivityWatch specifically:
Normal operation: Should be 10-30 MB/hour (mostly small database writes)
Your usage: 3-9x higher than typical
Possible Causes:
Verbose logging enabled - Check if debug logging is on
Screenshot capture - If AW is saving screenshots, this explains it
High polling frequency - Database writes happening too often
Database not optimized - SQLite writes not being batched efficiently
Watching many data sources - Multiple watchers running simultaneously
And this is writes, not reads.
So, is there an advance config setting that can put say a minute or 5 minutes of activity into memory and then batch update the database with that content?
If I lost 5 mins of activity due to an unexpected shutdown/bsod etc, I wouldn’t be worried.