How to edit watchers to display average daily time per week

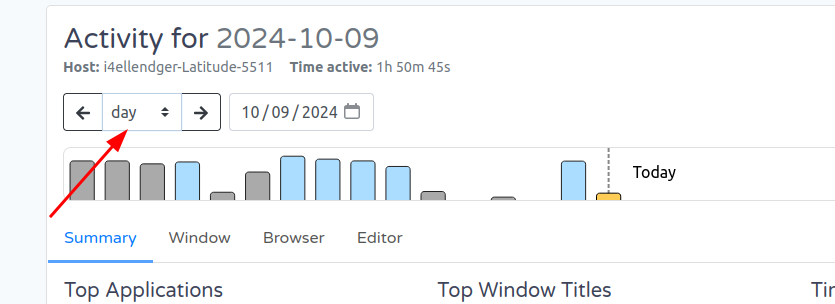
My goal is to see the average daily amount of screen time per week/month. I don’t know how to code, so I need very simple instructions.

I think the easiest method would be editing one of the current watchers to display this metric. If not this, then maybe creating a custom watcher.

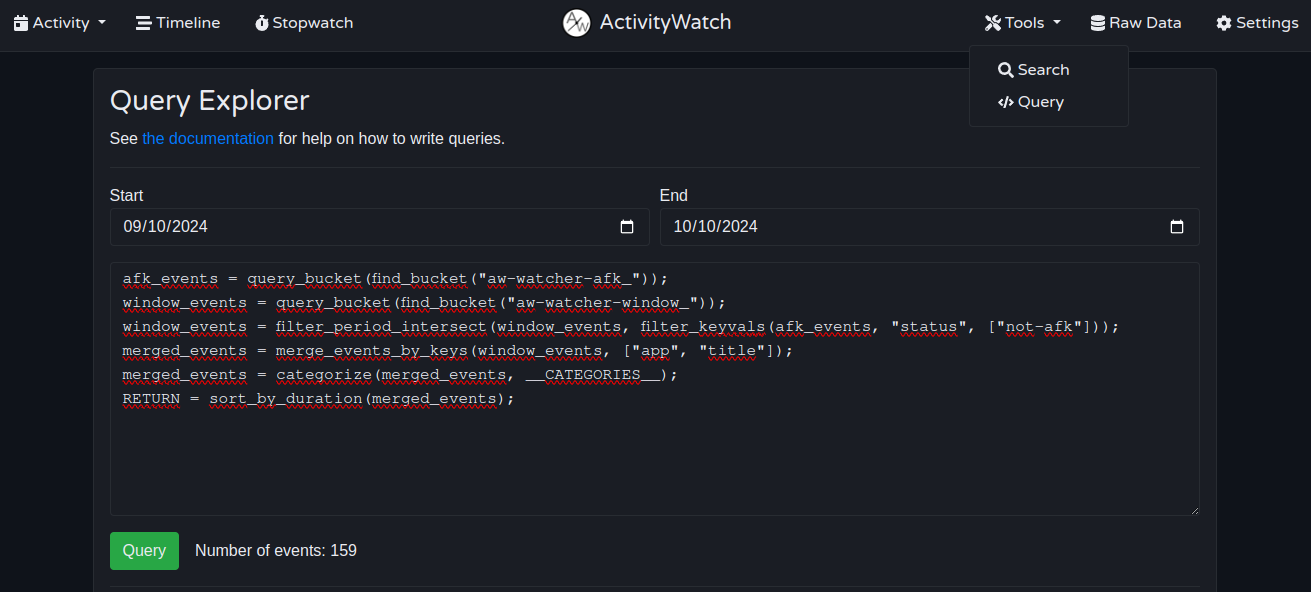
After exporting the current buckets, and opening the JSON file in Visual Studio Code, I’m lost at what step to take next. Or if this was even the right step.

Can someone please guide me in setting this up?

Just use highlighted switcher to show bars below on “per-week/month” basis instead of “per-day”. It is on the first “Activity” page in UI.

This would be as simple as dividing a weekly/month time report by the elapsed days. Probably the simplest way could be to just use “queries”.

In the Tools menu you can find the Query option. I’m not very familiarized with the syntaxis but you could check the doc, you may find the link on the same page.

On the standard “Timeline (barchart)” visualization, would it be possible to add a horizontal line representing the average time spent for the current duration? Ideally, hovering over the line would then display the average time per day/week/month.