Working on a project in several applications

Hi. It’s nice to see a WakaTime alternative. Thank You for You work!
In applications of this type (WakaTime too) I always lack such functionality that the project also includes (outside of editor work) time spent in the browser, e.g. Chrome at a specific address.
I have many projects and all the time I spent to built applications is:

example for project1:
80% coding in SublimeText (project1)
15% testing in chrome http://project1.loc
5% database managing at http://phpmyadmin/project1

Of course, during the day, I often switch between projects.

All I need is checking how many time (summary) I spent on project1, project2 etc. in given period of time (this month, last week etc.)

ActivityWatch is the first program that gives hope that it can be done, but for the time being:

  1. I don’t see an add-on to such a popular editor as SublimeText
  2. I don’t see the possibility of generating a report that would combine the work on one project in the browser and editor.

Is it/will it be possible?

1 Like

I don’t see an add-on to such a popular editor as SublimeText

Unfortunately we only have 3 editor watchers as of now since ActivityWatch is a rather small project and our editor support isn’t great yet.
We don’t have the resources to write watchers for all editors but lately we have received 2 watchers contributed from the community which has been very appreciated and hope to get more in the future since the implementation of a editor watcher isn’t very complicated (but there are still a lot of editors out there so a lot of work is still needed).

I don’t see the possibility of generating a report that would combine the work on one project in the browser and editor.

As you found out the closest thing currently you could find for this would be queries, but the queries themselves is mostly a tool for getting analysis from aw-server and the visualization itself is then yet another step needed to get everything visualized in a nice manner. To get the functionality you talk about we would probably have to:

  1. Land the “tagging” feature we’ve been talking about for a while
  2. Visualize your “tagged” events in a nice way in the webui

This is a lot of work, so if you need these features you have to be patient. But we have heard about multiple people before having a similar usecase to you so these features are large yet features inline with what the future of ActivityWatch will include.

So far, I’ll try to pull out as much as possible using query (thank you for your answer to github). All the data I need are in the database (even without the SublimeText plugin), you can extract from the window headers (each window title in SublimeText contains the name of the project). I believe that this is enough to generate a report that I am expecting (sum of hours from several applications at the same time). If not - it’s really close :slight_smile: I’m looking forward to further development, the idea is brilliant!
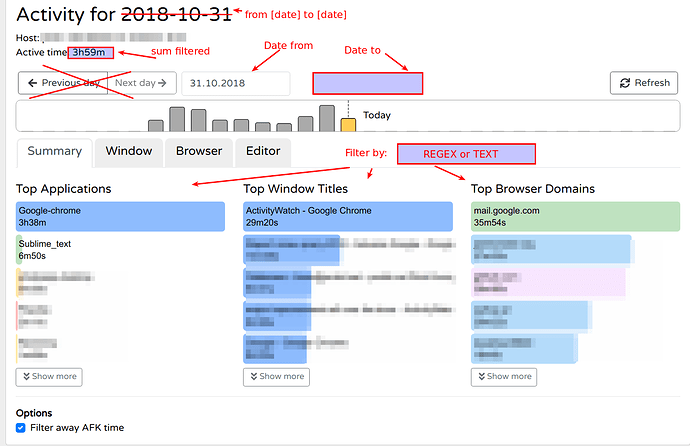
I believe that this can be done now by using filtered titles of the windows and URL’s.

For example, the work on the project1 is as follows

  1. Working with project1 database:
    Watcher: aw-watcher-web-chrome
    URL: h t t p://adminer.local/?username=homestead&db=project1&table=anytable
    the common part of the URL is “h t t p://adminer.local/?username=homestead&db=project1”

  2. Testing application in local enviroment (like above):
    Watcher: aw-watcher-web-chrome
    URL: h t t p://project1.loc/any_controller/
    the common part of URL is always “h t t p://project1.local”

  3. Working with code of project1 in SublimeText"
    Watcher: aw-watcher-window_
    Window title: any_file.php (project1) - Sublime Text
    the common part of the title is “(project1)”
    App: Sublime_text

So, theoretically we have everything we need to sum up and generate a report:

Query to sum every data with:

  • bucket: aw-watcher-web-chrome, containg URL “h t t p://adminer.local/?username=homestead&db=project1”
  • bucket: aw-watcher-web-chrome, containg URL "h t t p://project.local
  • bucket: aw-watcher-window_, App: Sublime_text, containing string in title “(project1”)

Am I wrong?
sorry for “h t t p” but its limit 2 url’s for new users :slight_smile:

You are correct, I just assumed that you wanted something more user-friendly!

All this is technically possible today, the reasons why I listed the 2 features before as required was because:

  • Tagging is necessary for saving your project tags such as the URLs and filename.php persistently, but you can of course simply hardcode these if you don’t care about extensibility.
  • If you only care about total duration and no graphs you obviously don’t need the webui part either!

No, I don’t need a graphical interface, just a summary of the time for the query. OK, if you confirm that it’s possible - I’m going further into the QUERY analysis :slight_smile: Tkank You!

I still have a problem with building an appropriate query that will sum up the data from the windows with the given title (aw-watcher-window_) with the appropriate URLs (aw-watcher-web-chrome).
It would be very helpful if someone added some examples of queries compatible with the latest version of the query (the best example of using all possible features available in QUERY). I think that with as much work as you have put into the creation of this great tool, it is very important to show users how to use this tool (this would certainly make many users happy). The work put into several paragraphs of the documentation more is a proverb for all the work that has been put in so far. However, this is really a very important element. Thank you in advance :slight_smile:

Been abroad the past few days so been unable to respond.

Have you been able to fix it or still need help?

If you want examples of queries that are always up to date, take a look at the webui queries

Not everyone can analyze Python code (not everyone is a Python programmer). The possibilities of using QUERY should be described in detail in the documentation along with examples. Besides, it seems to me that the display of filtered results could be simplified. Everything could take place on the “Activity” tab. (Web UI). It would suffice to add the ability to filter the data. At the same time, the data would be presented graphically. A small modification of this tab would suffice.

Of course we could, but for most people it makes sense to show the data on a day-to-day basis. Making the user have to select date ranges is bad UX because he now needs to select both startdate as well as enddate. We want the view to be simple, but we could consider adding a advanced view or such.

The user would not have to change anything. Of course, the default range of dates would be one day, so it should not disturb anyone (exactly as it is currently on the “Query” tab.). It changes the range only the one that needs it. I think that the possibility of filtering data on the “Activity” tab would be much more attractive. That’s just a suggestion, of course.

I do a bunch of analysis in the aw-research repo that relate to tagging and such, and works fine if you can write a little Python to do basic project/category tagging. See this PR and the whole file classify.py that is edited in it:

Not all of it can be nicely done using only queries, yet. But works fine with some Python glue (although it means it won’t be in the browser for a while).


The user would not have to change anything. Of course, the default range of dates would be one day, so it should not disturb anyone (exactly as it is currently on the “Query” tab.)

I have plans to “streamline” some parts of the Activity tab, and such a streamline currently includes a more flexible way to select a timeperiod. (I think it’s a very common thing to want to compare one week, month, year). Better than the one in the query view for sure.

It sounds great, I can’t wait to Activity tab changes.Thanks!

1 Like